Cape Elizabeth Real Estate
View properties for sale
View properties for sale
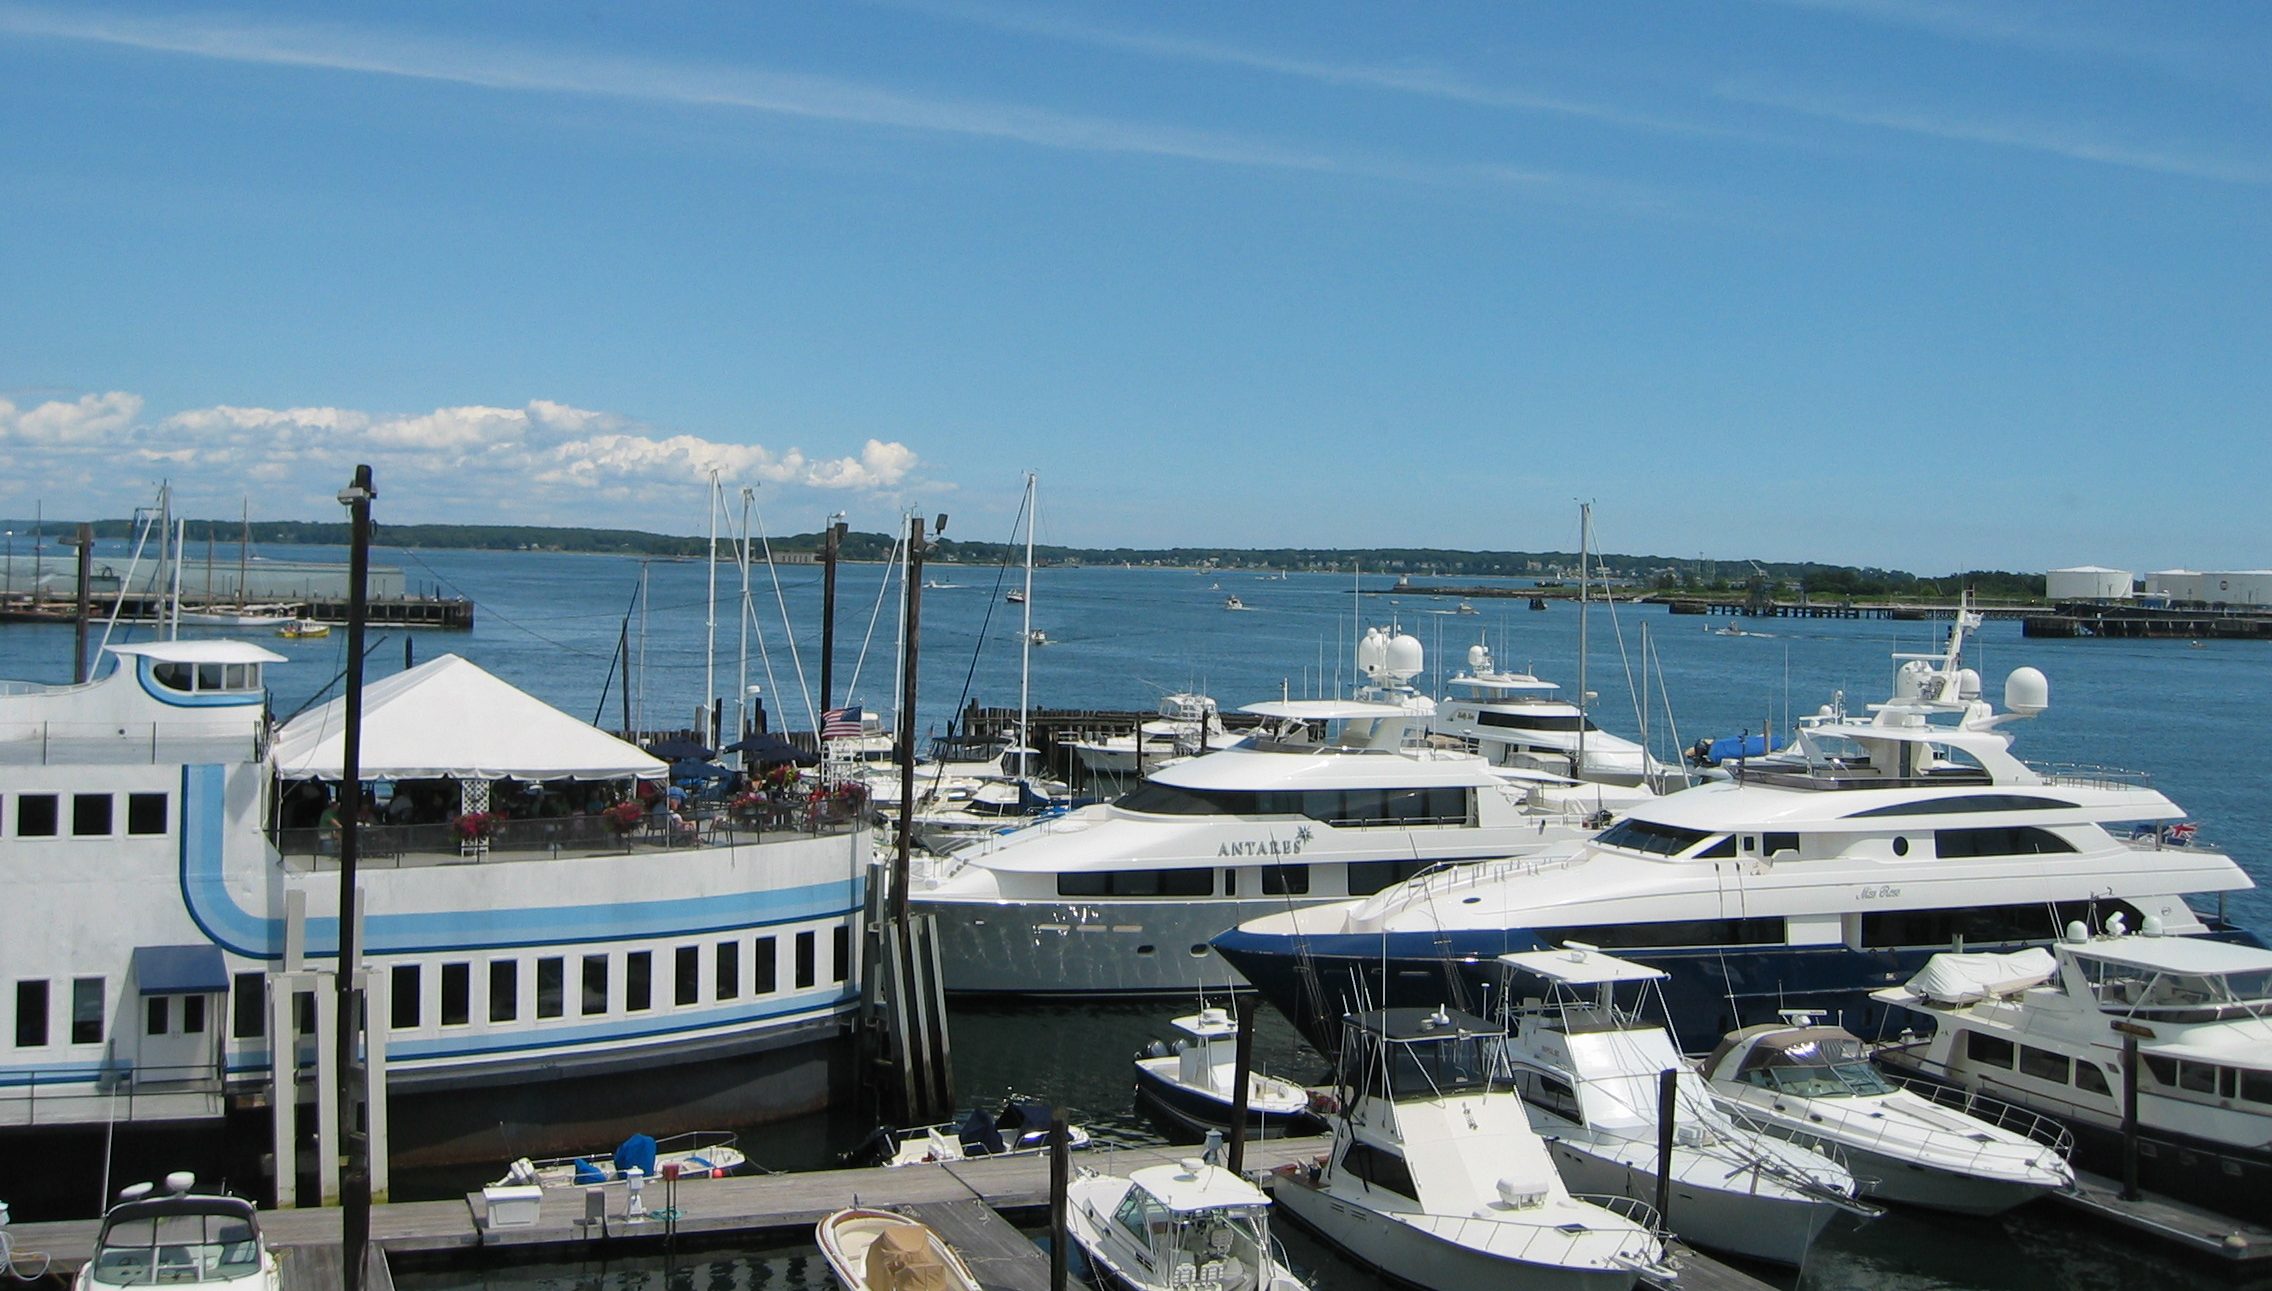
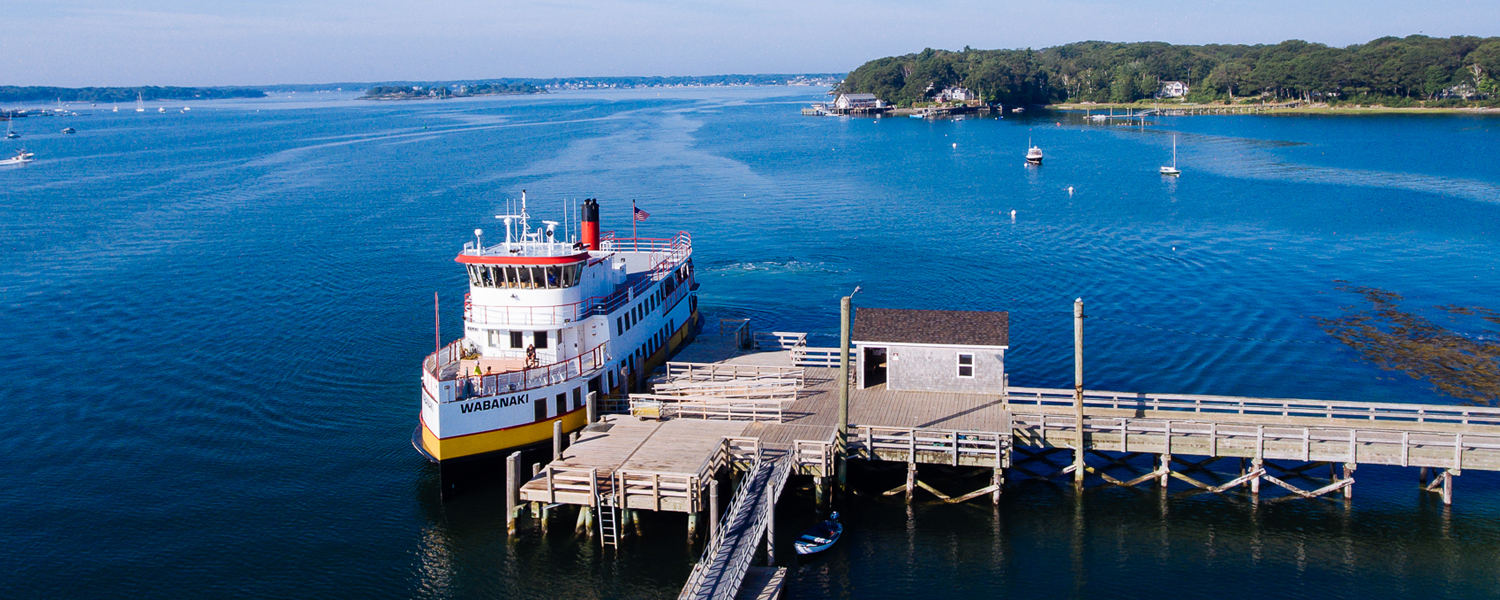
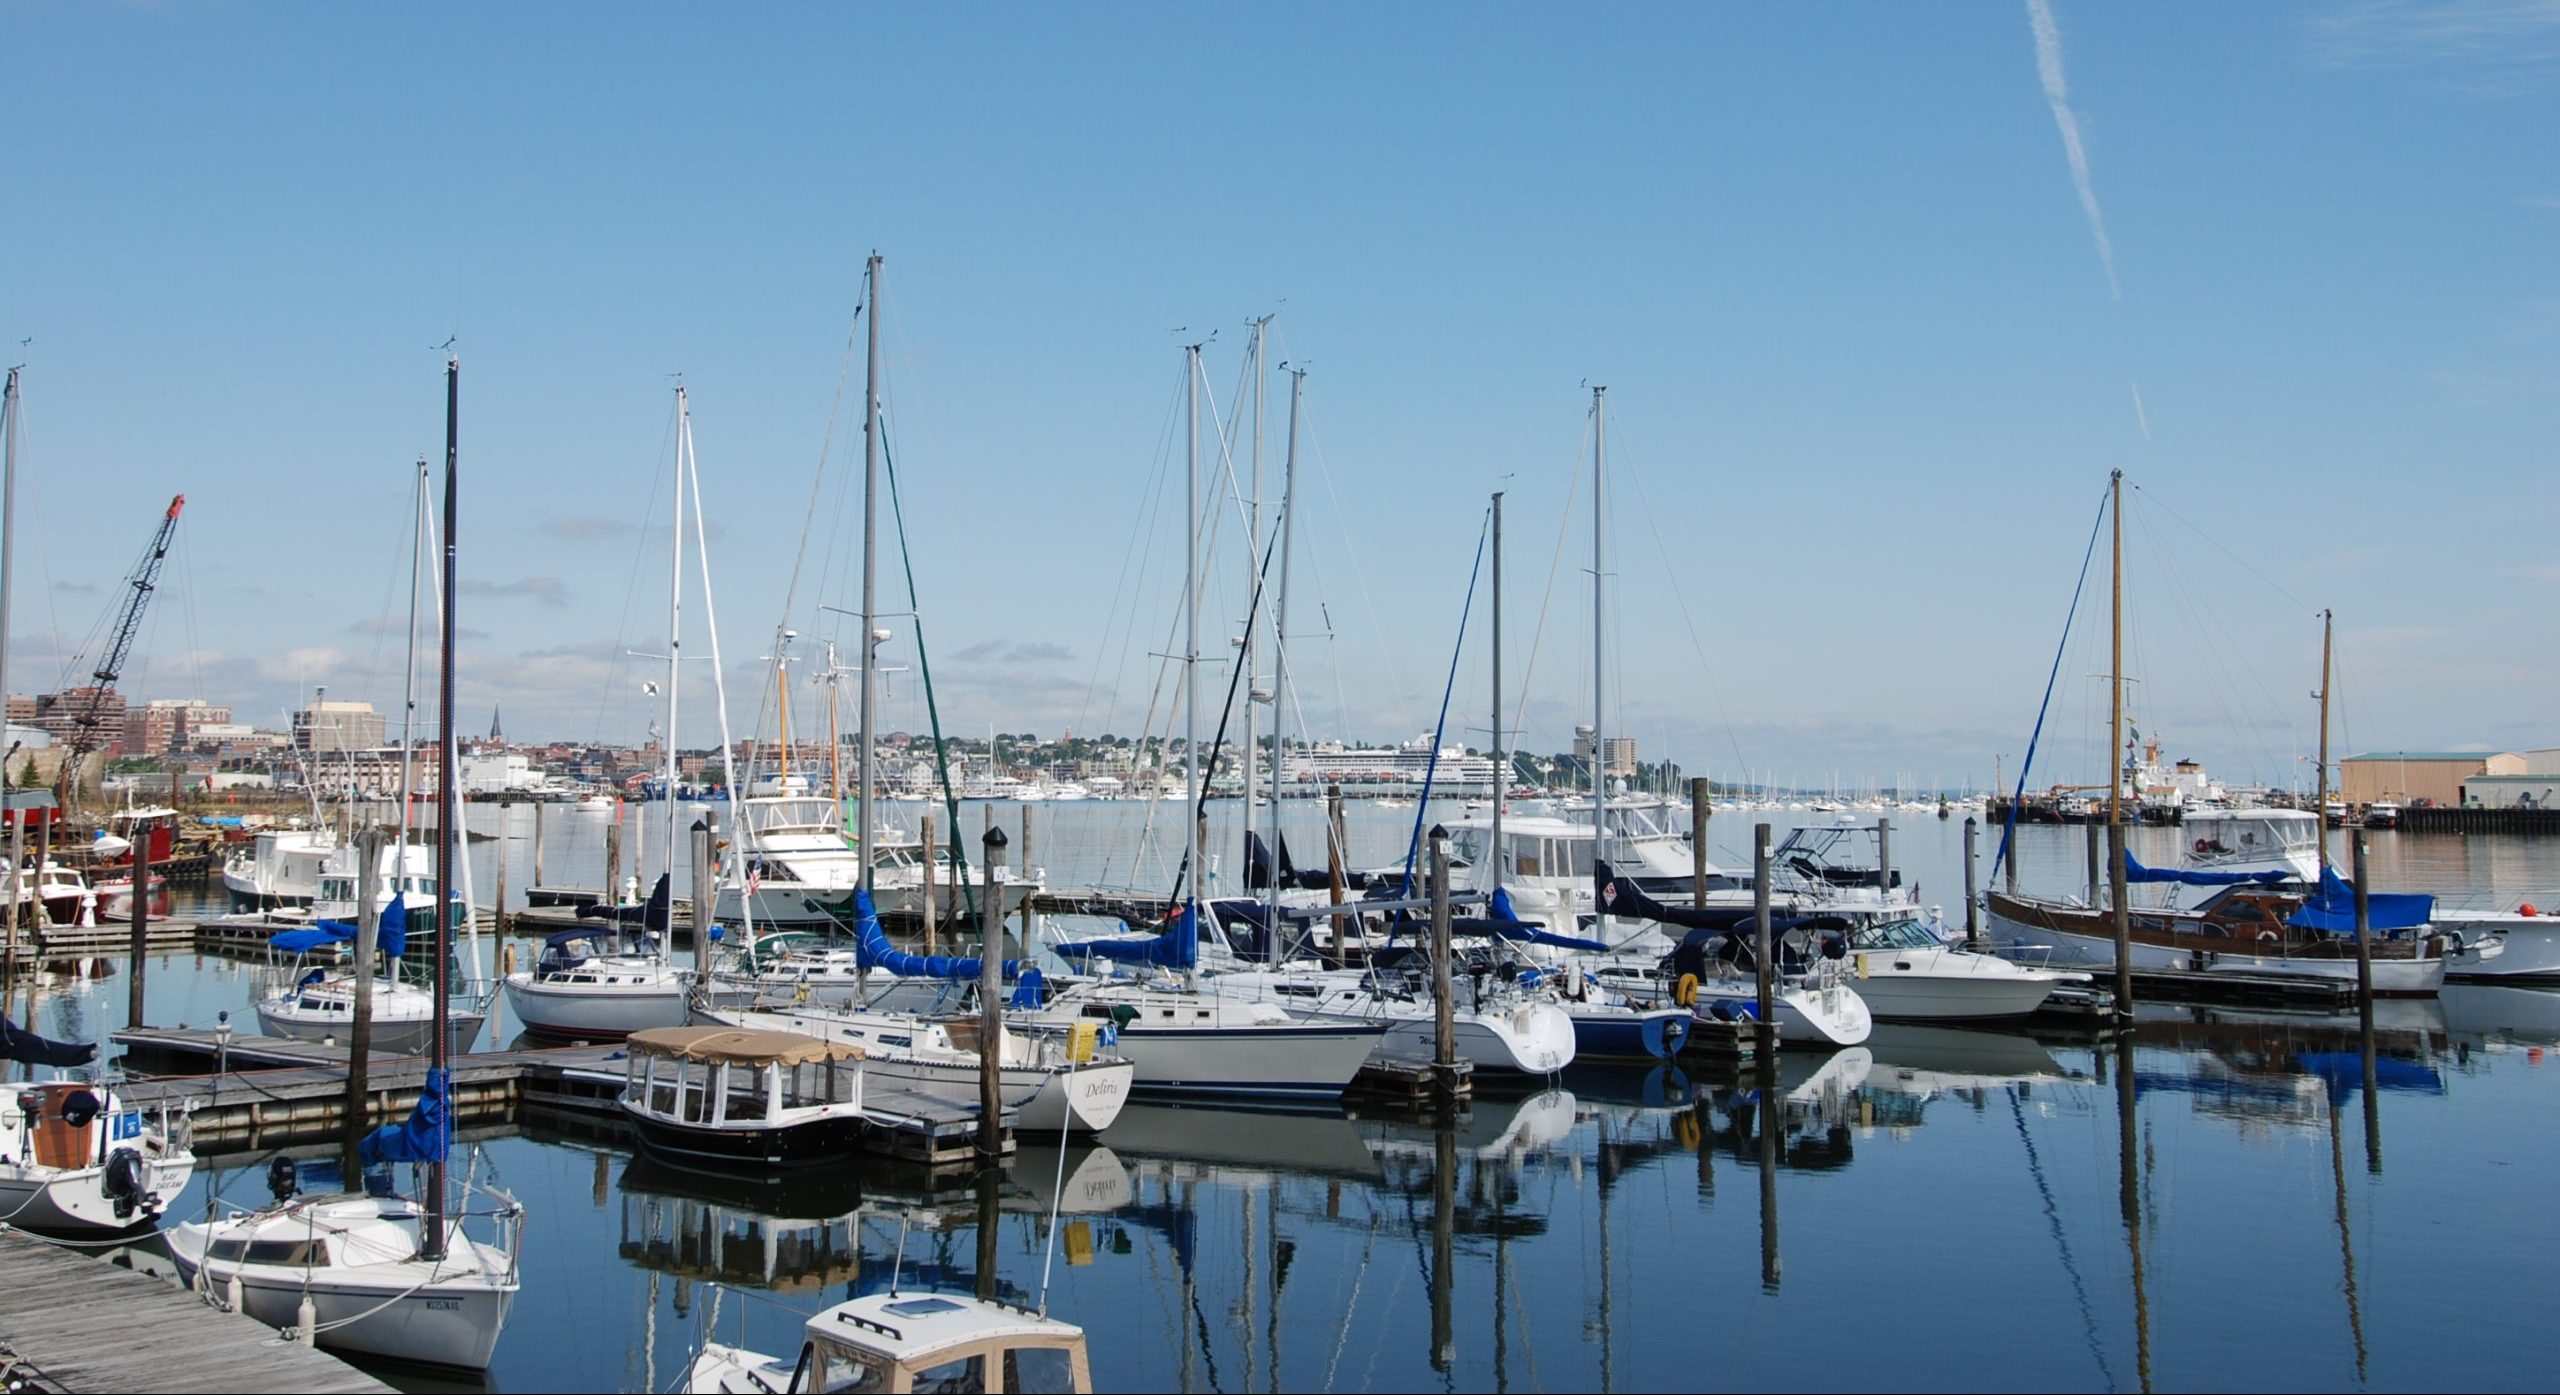
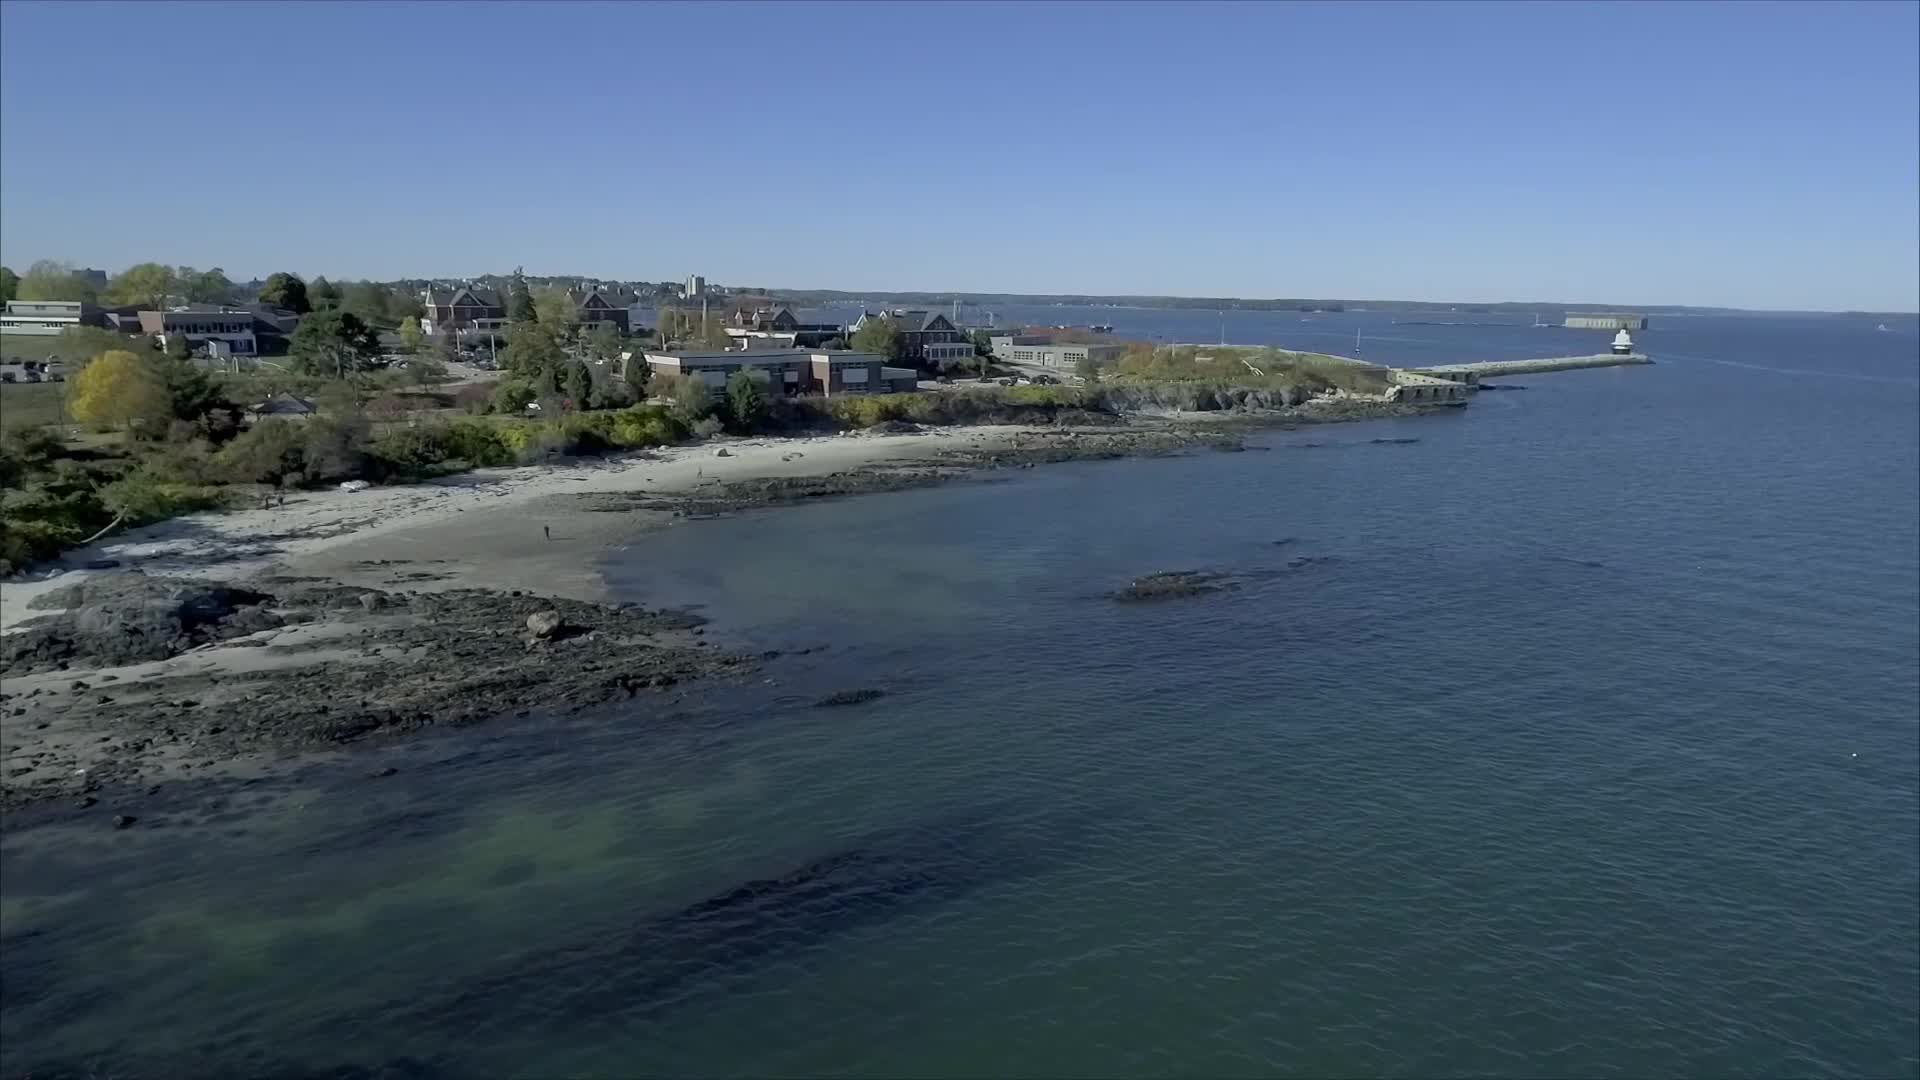
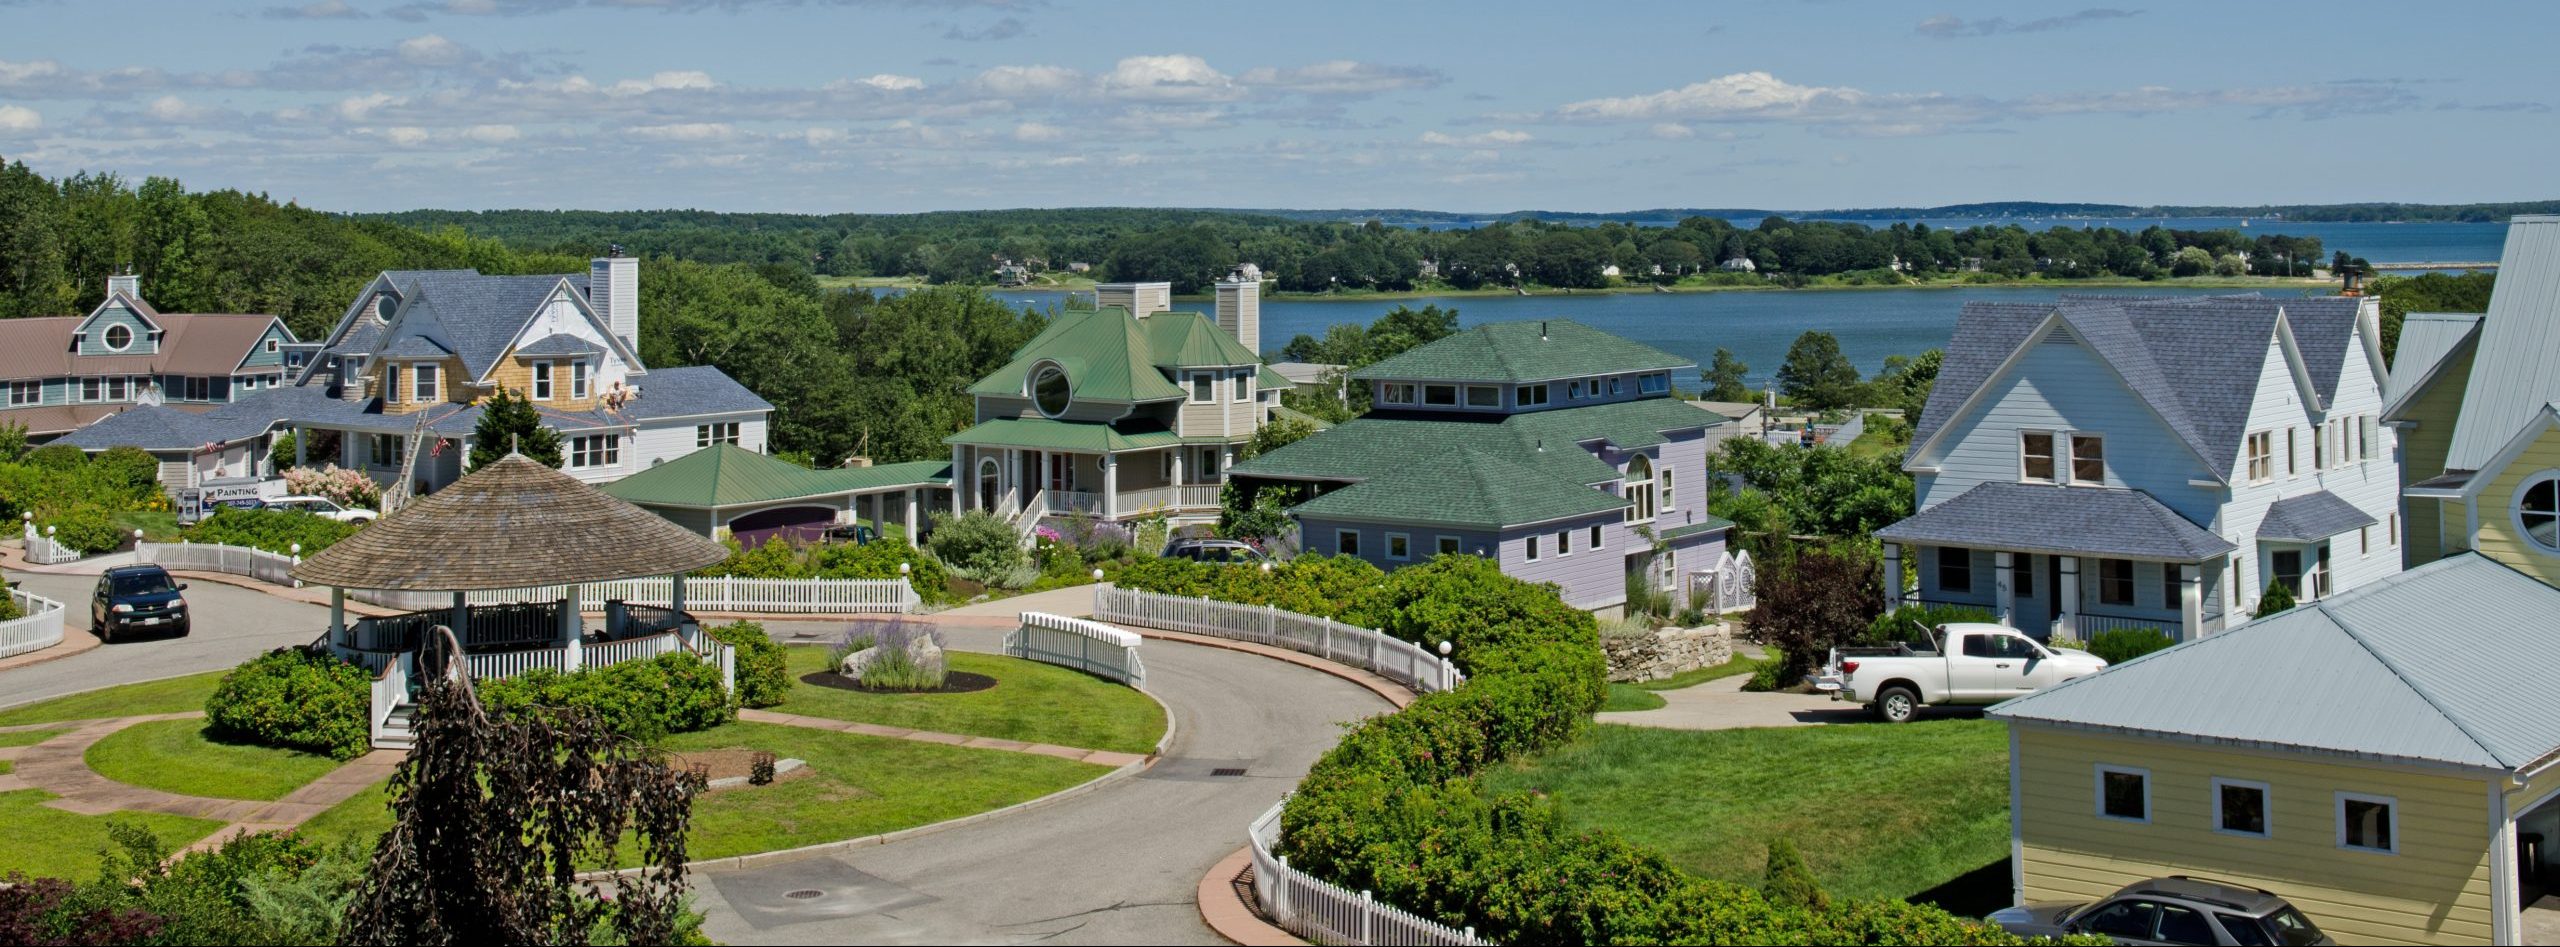
Cape Elizabeth, a coastal treasure, proudly boasts the captivating Fort Williams State Park, renowned for its timeless beauty and iconic Portland Head Light, while embracing miles of pristine coastal waterfront. Recognized as a premier destination for both tourists and year-round residents, Cape Elizabeth extends its warm embrace with accessible public beaches and an outstanding school system. Real estate options include homes along the coastline or others within close proximity to the beaches.
This enchanting town also reveals its hidden gems in the form of charming multi-acre inland homes, some nestled within the heart of working farms and coastal homesteads, offering a unique and idyllic lifestyle. All of this is conveniently located just a stone’s throw away, just across the bridge from the vibrant city of Portland, with its abundance of amenities and cultural offerings.
Live out of your imagination, not your history.
At Maine Home Connection, we channel our unwavering commitment and passion into delivering unparalleled real estate excellence. If you’re contemplating a property purchase in Maine, seize the opportunity to empower your decision with our latest Relocation Guide.
Imagine More!

