Scarborough Maine Market Report
Home Sales Statistics & Results - 2019 vs 2018 Update
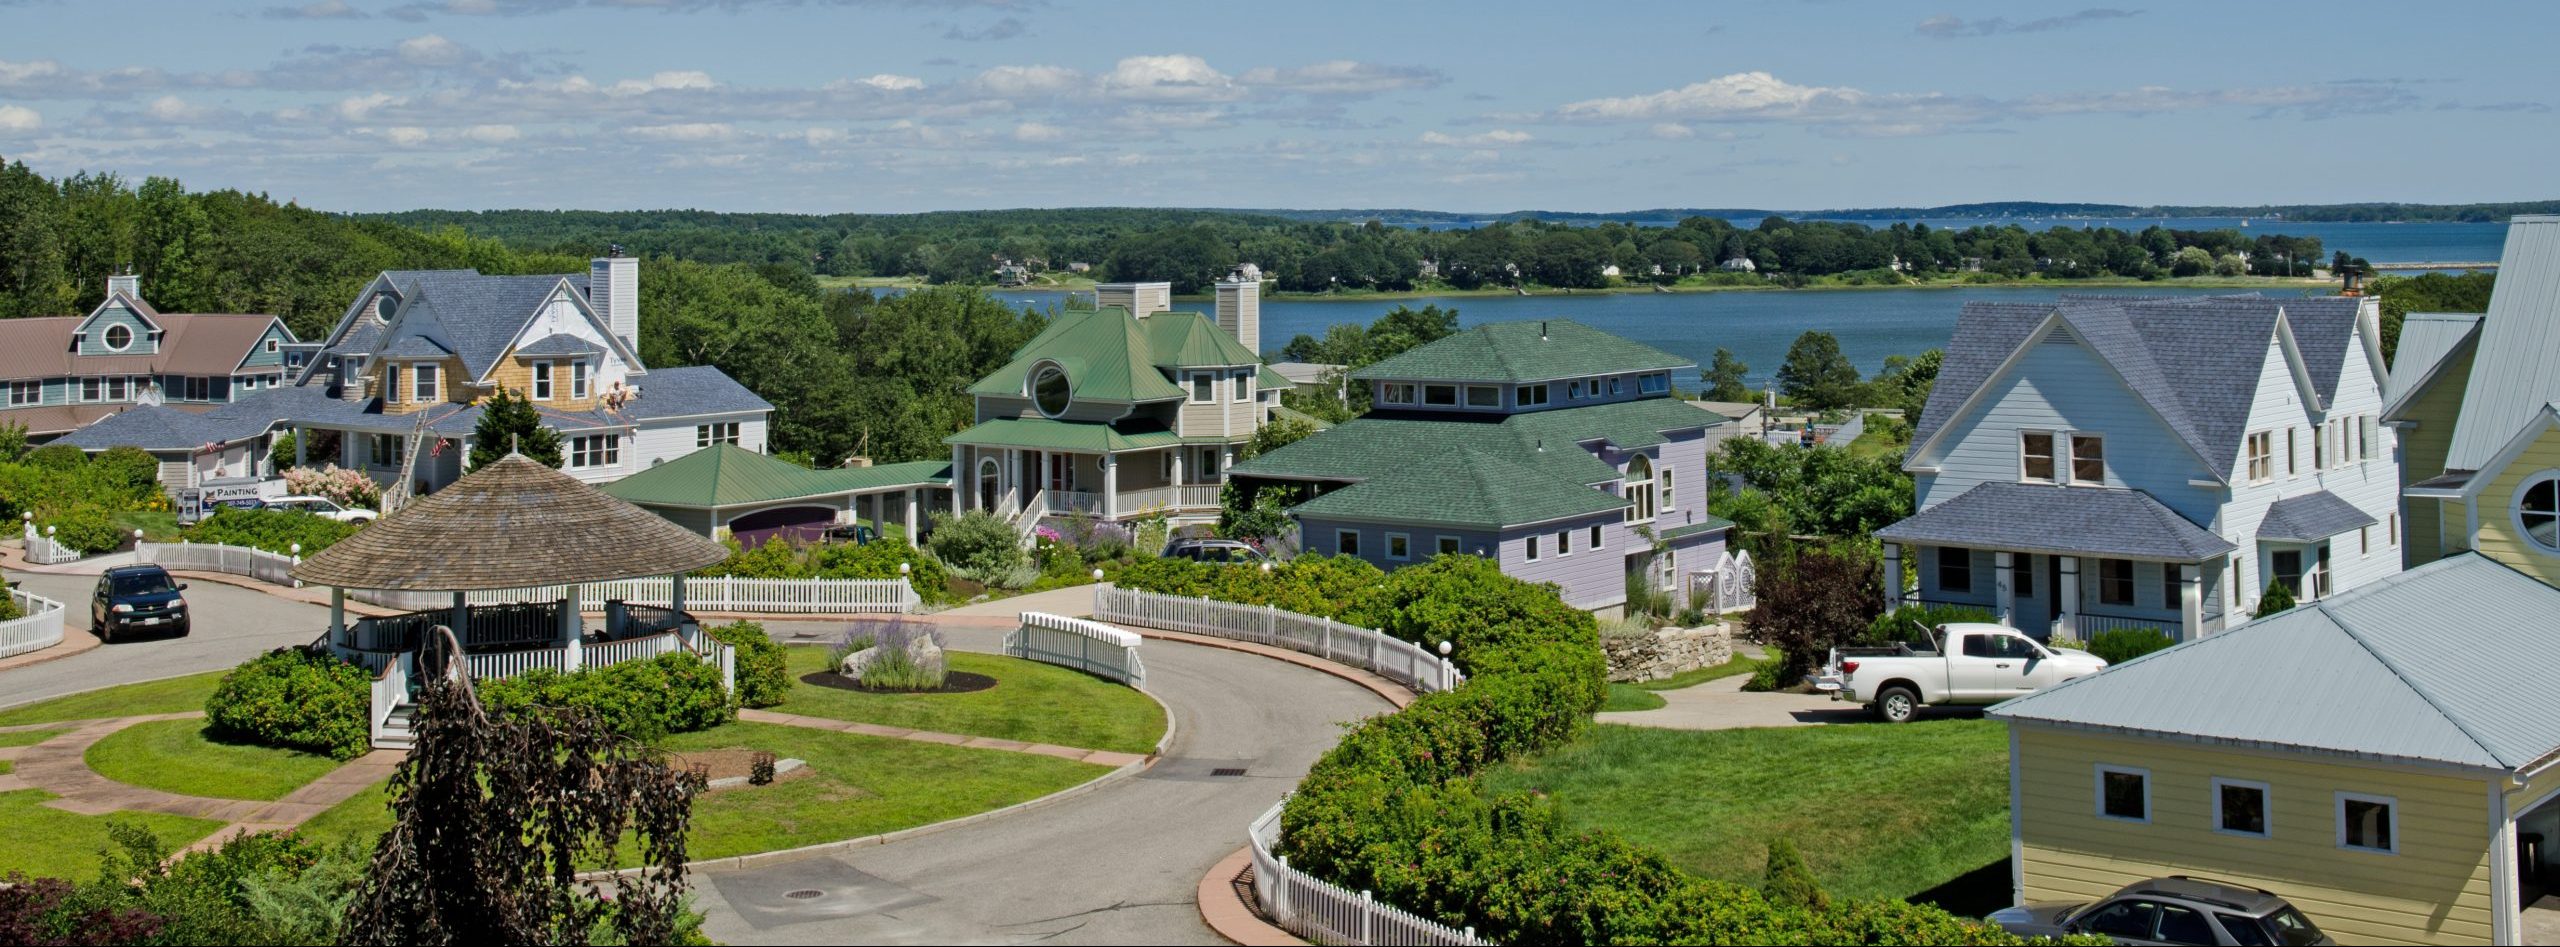
Scarborough offers a wide range of real estate options. There are areas along the ocean (Pine Point), many larger subdivisions within close proximity to the local business districts and a generous selection of existing homes that offer larger rural lots that are often surrounded by trees. There are also many opportunities for new construction.
After four consecutive years of growth, single family homes sales decreased in 2019 2.4% from 361 to 359.
The charts below include up-to-date 2020 monthly sales and a review of the complete years 2018 and 2017 for all types of properties.
|
2020 Sales: YTD Results Through December
|
|
Prop Type |
|
Median Prices YTD 2020 | 2019
|
|
Unit Sales YTD 2020 | 2019
|
|
% of List Price
|
|
DOM |
|
|
|
|
|
|
|
|
|
Homes |
|
$480,000 |
$417,500 |
|
330 |
352 |
|
101.06% |
|
6 |
Condos |
|
$319,000 |
$256,000 |
|
57
|
112 |
|
98.18% |
|
6 |
|
|
|
|
|
|
|
|
|
|
|
All housing data has been compiled from research by Maine Home Connection using information from the Maine Real Estate Information System (MREIS). |
|
|
|
2019 Scarborough Real Estate Sales & Prices
|
|
Prop Type |
|
# of Units |
|
Sold Price Median | Average |
|
Days on Mkt Med | Avg |
|
% of List |
|
$/Sq Foot |
|
|
|
|
|
|
|
|
|
|
|
Homes |
|
352 |
|
$417,500 |
$476,358 |
|
11 |
32 |
|
98.9 |
|
$200 |
Condos |
|
112
|
|
$256,000 |
$314,929 |
|
31 |
74 |
|
100
|
|
$220 |
Multi |
|
5 |
|
$375,000 |
$390,580 |
|
25 |
54 |
|
98.2 |
|
$155 |
Land |
|
12 |
|
$160,000 |
$278,083 |
|
71
|
170 |
|
95.5 |
|
NA
|
|
Demand in Scarborough increased in 2018 as seen in both the home prices increasing .9% and (DOM) median days on the market decreased 47.36%.
|
2018 Scarborough Real Estate Sales & Prices
|
|
Prop Type |
|
# of Units |
|
Sold Price Median | Average |
|
Days on Mkt Med | Avg |
|
% of List |
|
$/Sq Foot |
|
|
|
|
|
|
|
|
|
|
|
Homes |
|
359 |
|
$405,000 |
$451,943 |
|
10 |
36 |
|
96.4 |
|
$192 |
Condos |
|
44 |
|
$255,000 |
$357,613 |
|
7 |
50
|
|
98.1
|
|
$209 |
Multi |
|
4 |
|
$388,000 |
$399,812 |
|
12 |
11 |
|
98.2 |
|
$163 |
Land |
|
27 |
|
$135,000 |
$158,874 |
|
47 |
92 |
|
100 |
|
|
Statewide Results:
For the fourth consecutive year, Maine home sales set a new record in 2018 as 17,983 single family homes were sold, representing an increase of 1.0% over 2017 when total volume was 17,810
The YTD (Year-to-Date) median single-family price of $215,000 represented a 7.5% increase over 2017. Overall, pricing was up in 13 of Maine’s 16 counties, and remained consistent in two. The highest single month was May at $244,839, followed by April and then March.
Each month of 2018 was higher than 2017. Between 2007 and 2011 median prices declined each year, reaching their lowest level in 2011 at $165,000. From 2012 onward, pricing has increased ever year, with one exception - 2014.
|
|
|
Scarborough Sales History |
Year |
Units |
Price |
2019 |
352 |
$417,500 |
2018 |
361 |
$405,000 |
2017 |
350 |
$401.250 |
2016 |
348 |
$369,000 |
2015 |
339 |
$365,000 |
2014 |
292 |
$334,138 |
2013 |
297 |
$337,700 |
2012 |
216 |
$311,000 |
2011 |
196 |
$329,450 |
2010 |
197 |
$319,000 |
2009 |
192 |
$312,500 |
2008 |
178 |
$327,575 |
2007 |
222 |
$333,750 |
2006 |
228 |
$357,485 |
2005 |
246 |
$323,750 |
|
|
|
Active vs Pending Listings Residential

Months of Inventory Residential

2019 Report Download Market Repot

|