South Portland Real Estate
View properties for sale
View properties for sale
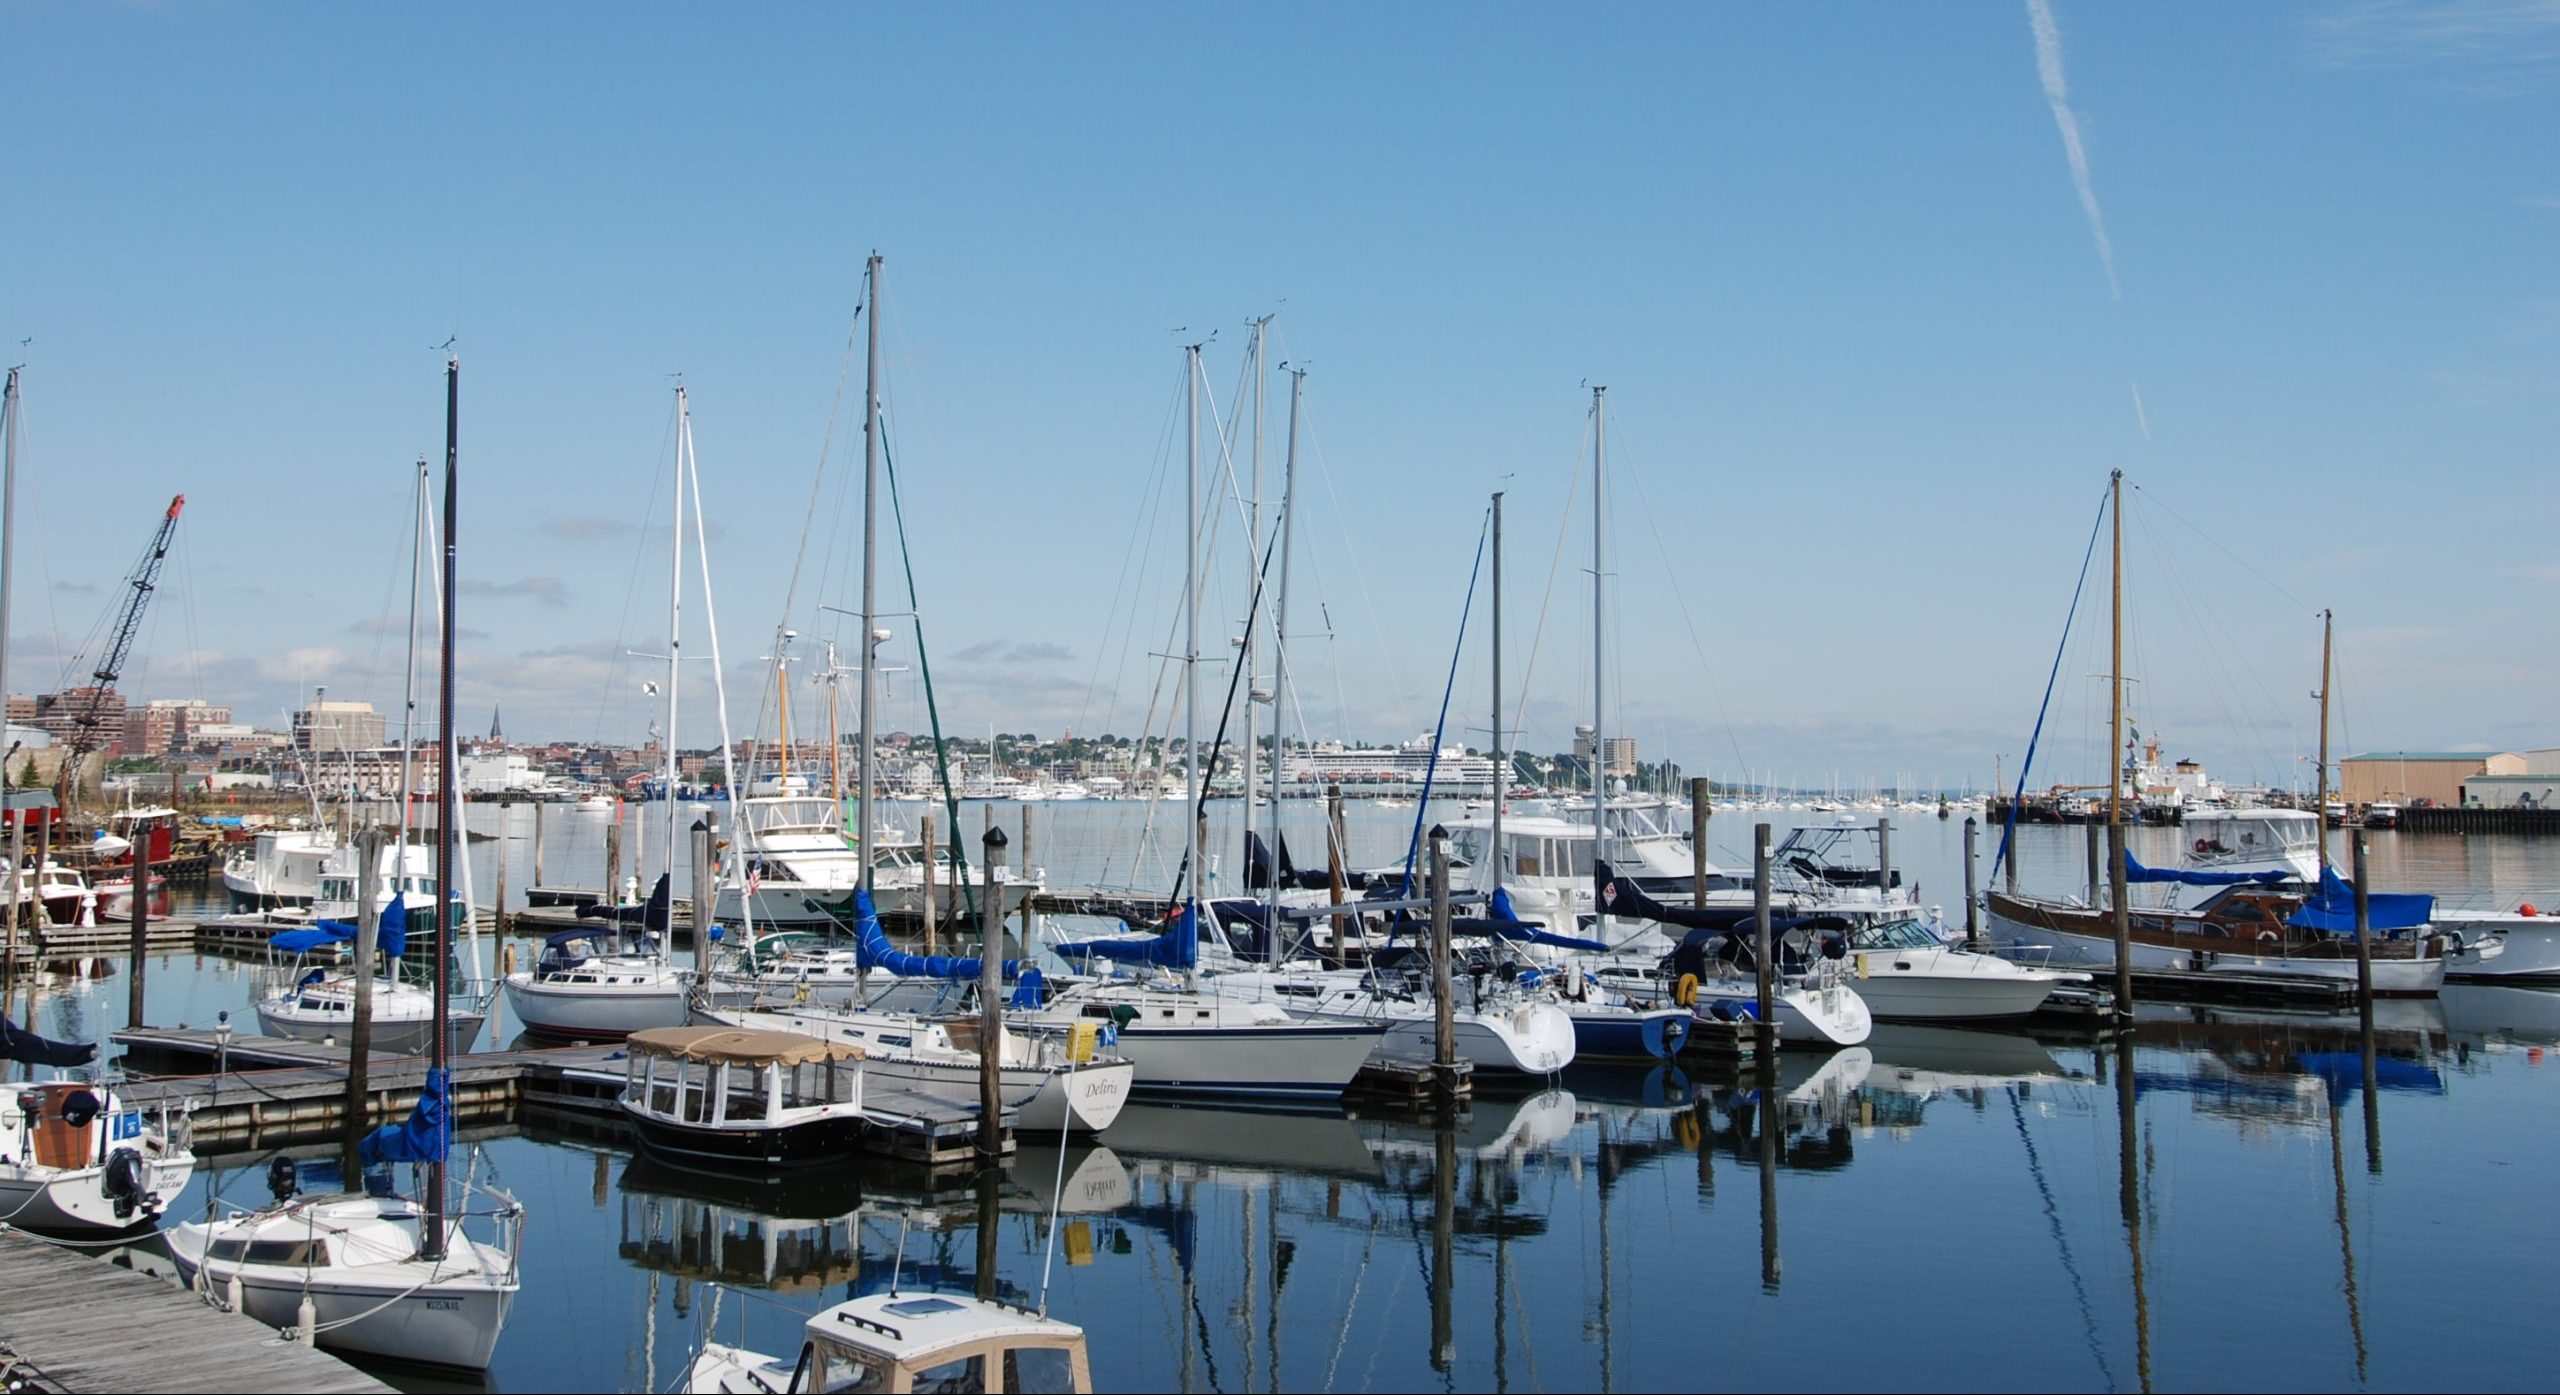
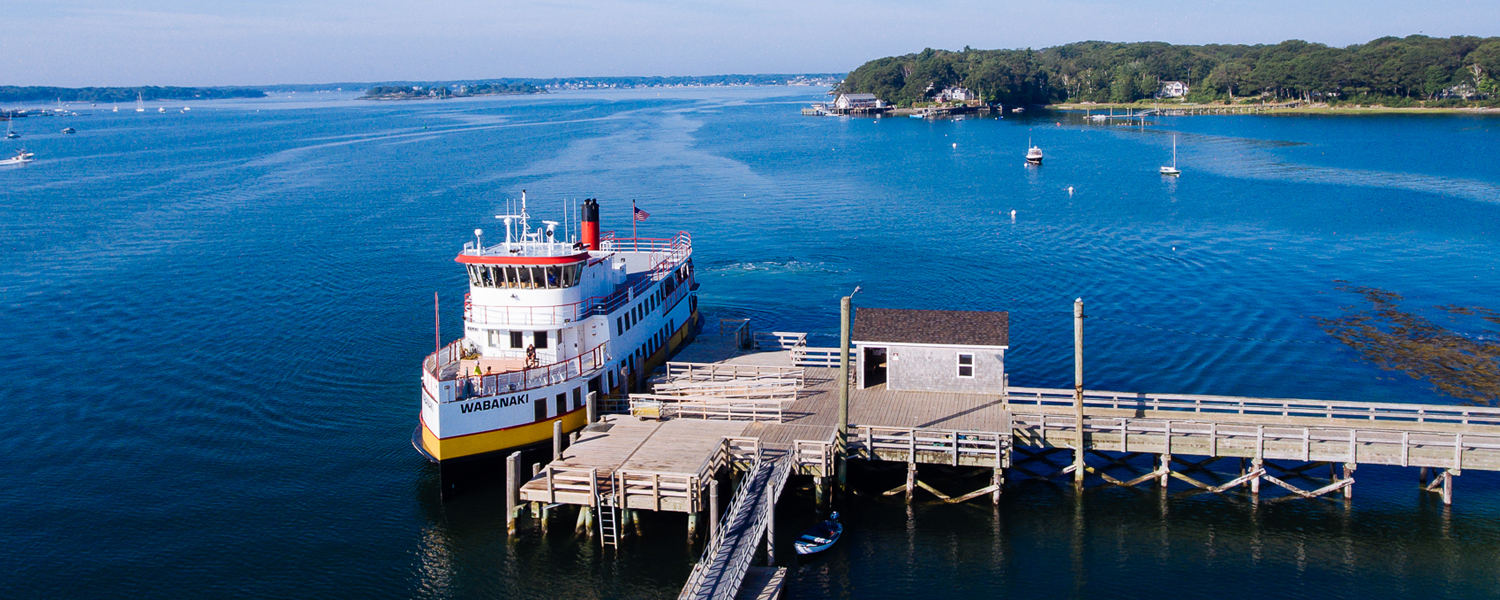
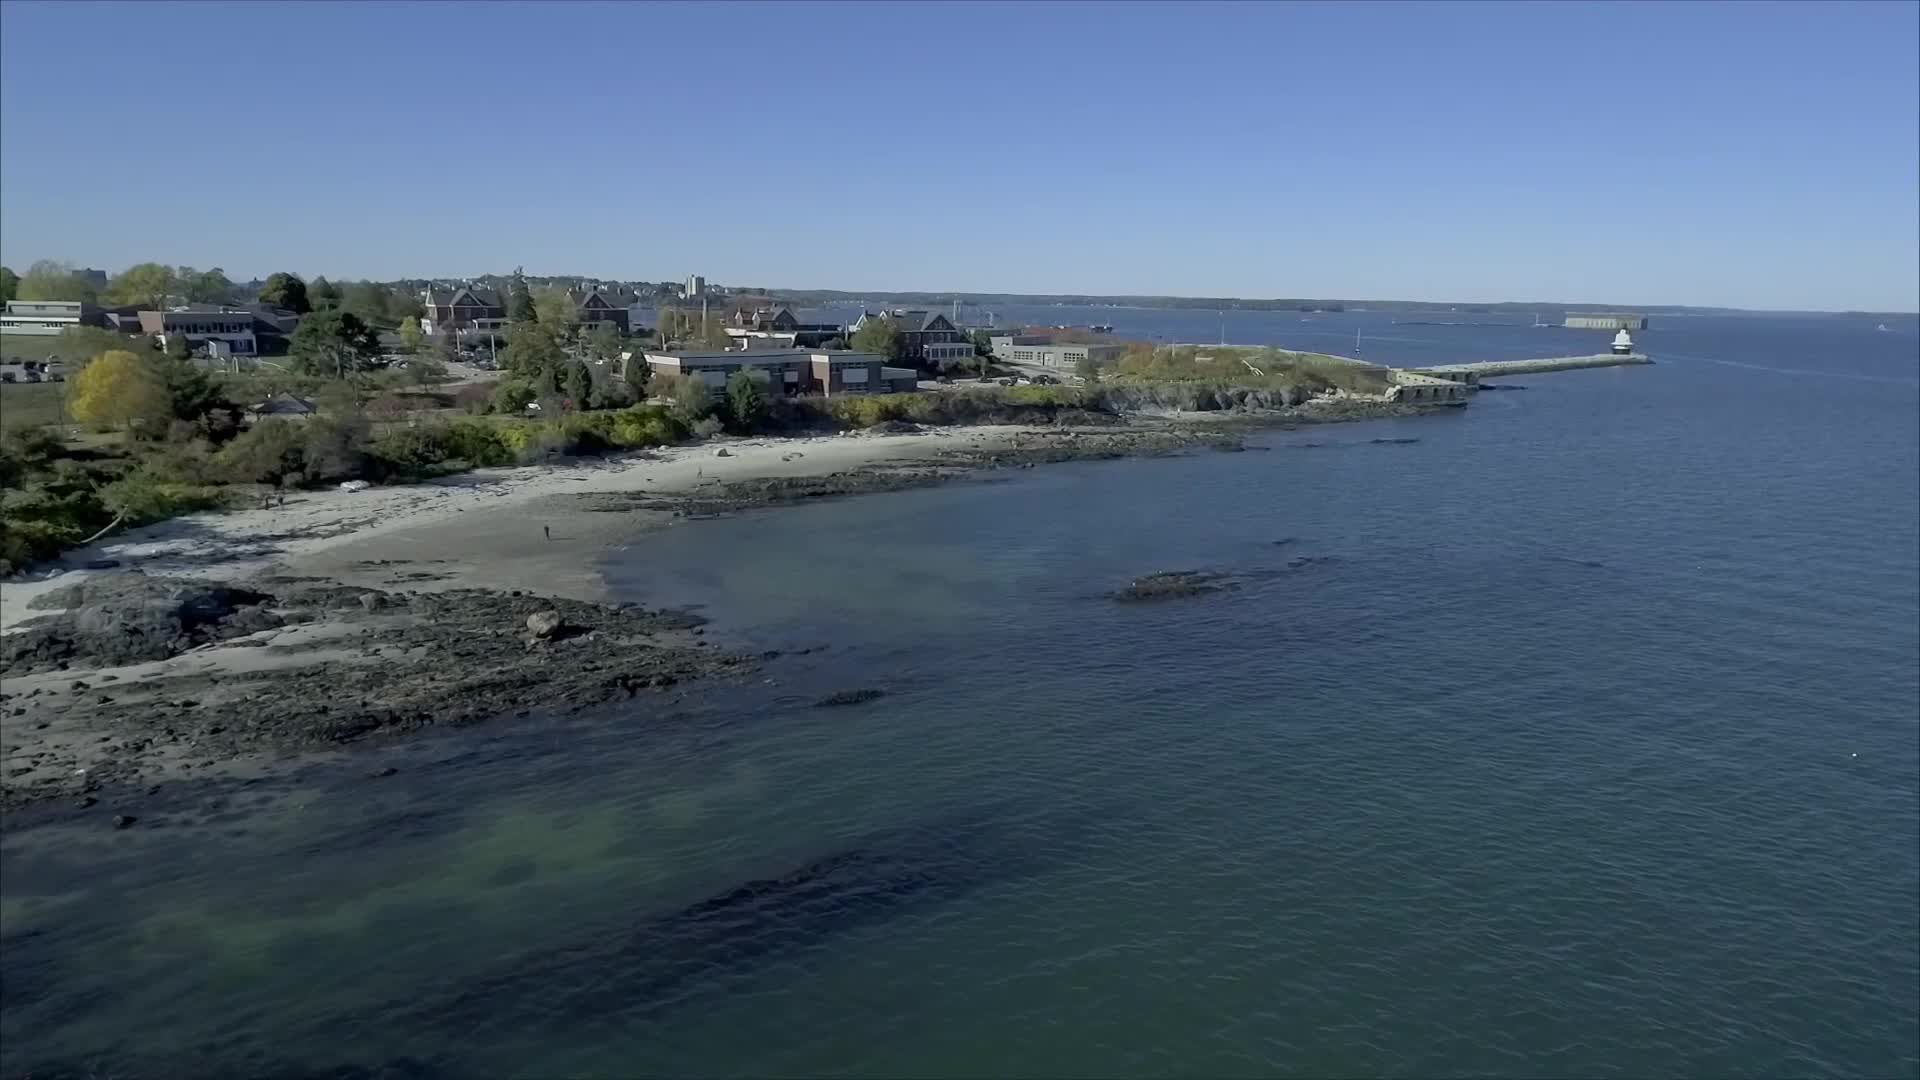
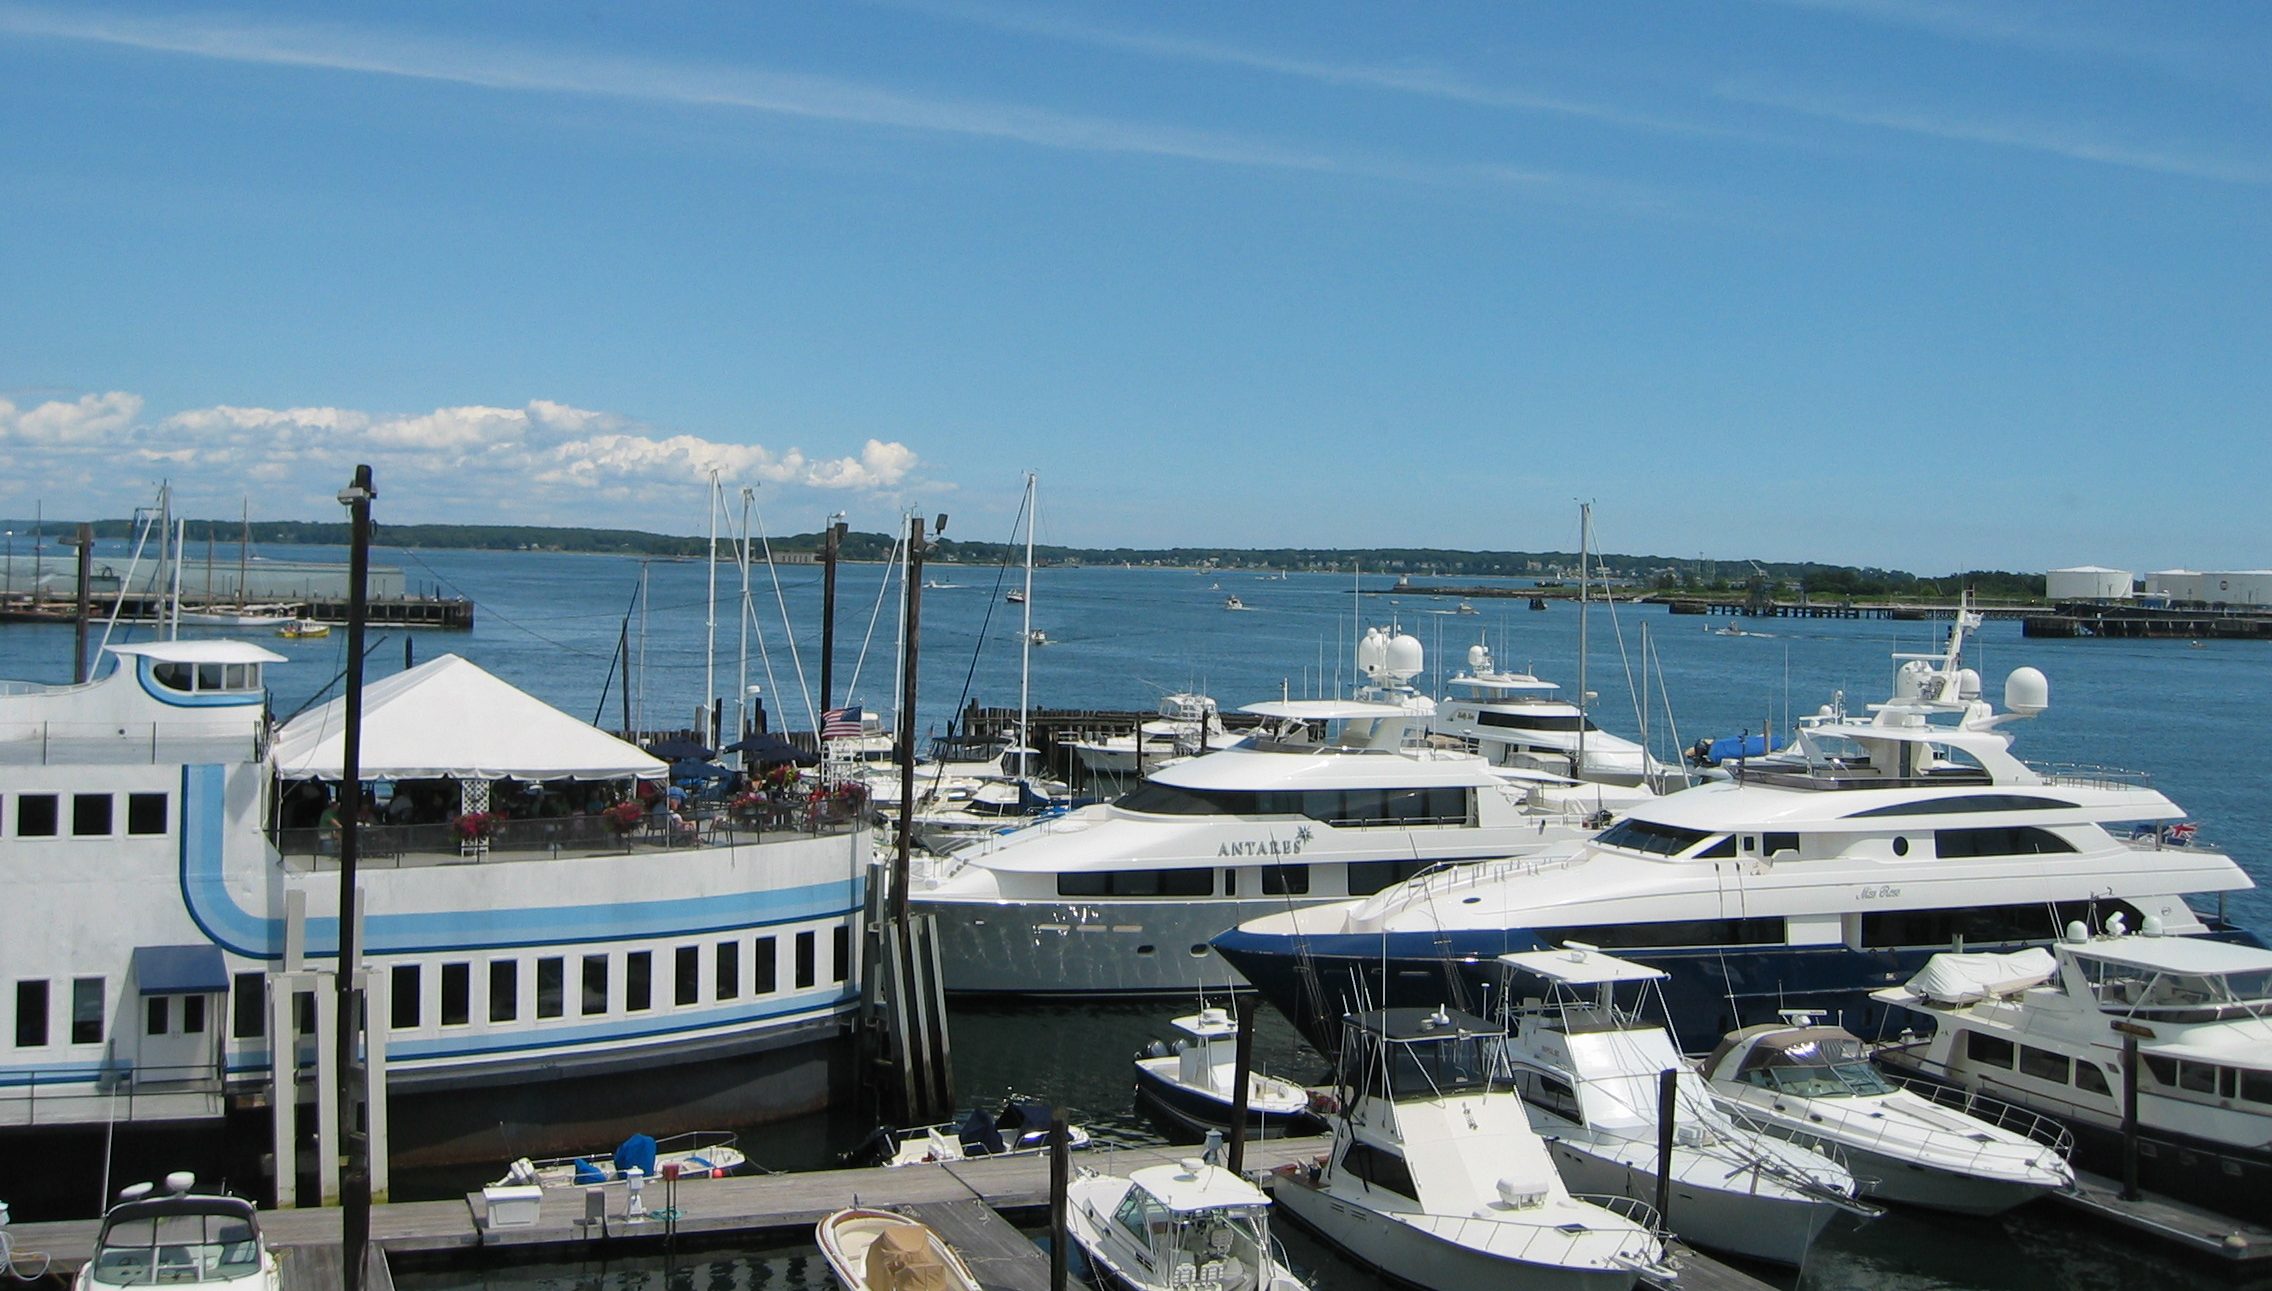
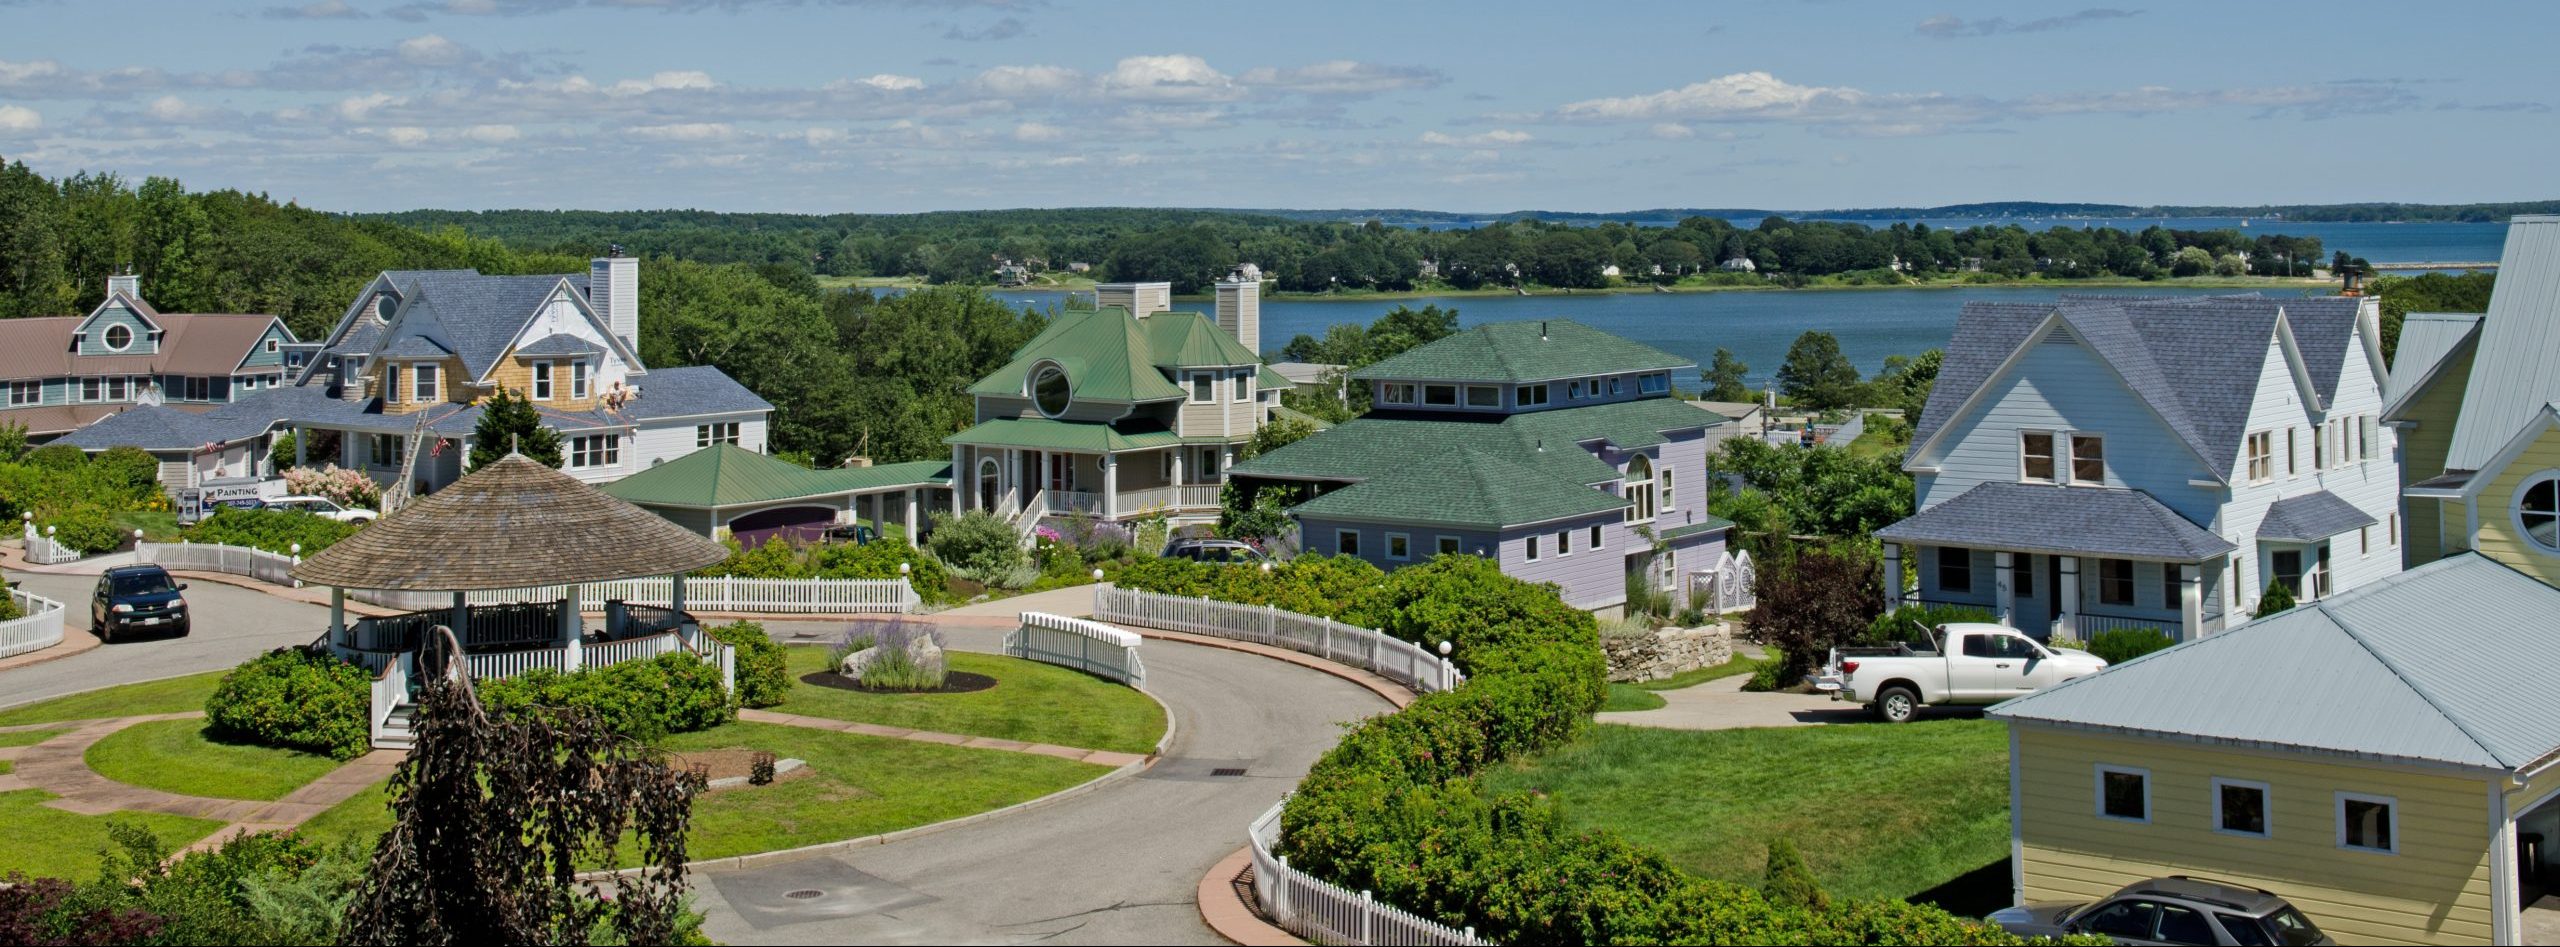
South Portland graces the southern shoreline of downtown Portland, seamlessly connected by the iconic Casco Bay Bridge. Renowned for its thriving working waterfront, this coastal gem nestles itself along the pristine shores of Portland Harbor, affording breathtaking vistas of Portland’s dynamic skyline and the enchanting Casco Bay islands. This suburban haven boasts a plethora of tranquil neighborhoods, tailor-made for families and individuals seeking proximity to the vibrant heartbeat of Portland while relishing the tranquility of suburban living. With a robust commercial center and serene residential enclaves, South Portland harmoniously blends convenience and serenity, making it the perfect place to call home.
The lunatic, the lover, and the poet, are of imagination all compact.
At Maine Home Connection, we channel our unwavering commitment and passion into delivering unparalleled real estate excellence. If you’re contemplating a property purchase in Maine, seize the opportunity to empower your decision with our latest Buyer’s Guide.
Imagine More!

